Wind roses for 2012
Continuing our efforts in analysing weather data, as done for year 2011, we have produced the wind roses for about 3000 locations starting from the METAR data measured during year 2012. The Perl scripts which automatically download METAR data, decode them, and create wind roses required about 17 days to complete the operation. An example of METAR string before decoding is available here.
A wind rose is a chart which gives a view of how wind speed and wind direction are distributed at a particular location over a specific period of time. It is a very useful representation because a large quantity of data can be summarised in a single plot. Wind roses contain important information and are used in different fields as, for example, in air quality studies, in designing energy saving buildings, and in positioning wind turbines.
The wind roses created starting from the METAR data for year 2012 can be viewed in Google Earth, or directly in your browser with Google Maps. We have produced the wind roses with a careful analysis of the METAR data, however, we do not guarantee that the wind roses are correct, and the user can use such images under her/his own responsibility.
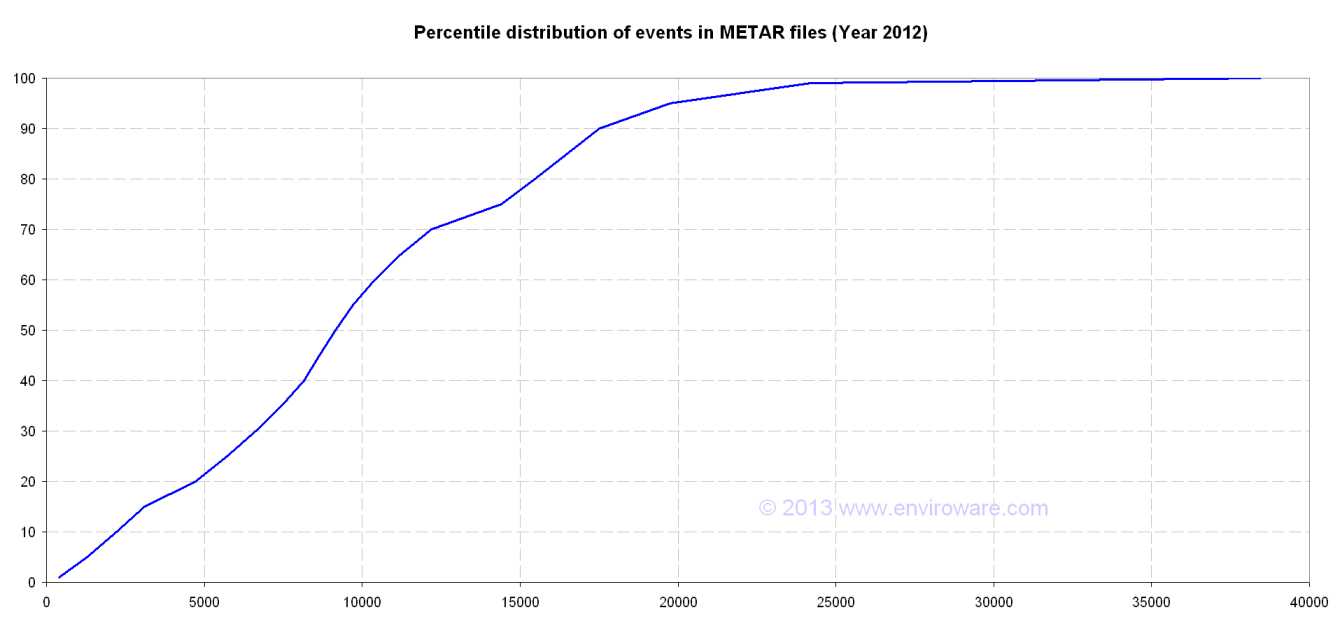
We have considered only the wind roses obtained from at least 100 events. The percentile distribution of the number of measures within the METAR files with more than 100 measures is shown below. The maximum number of measures, which is about 38500 (roughly one every 15 minutes), is carried out at Leeuwarden (The Netherlands). The median of the distribution corresponds to about 9200 measures, which approximately means one measure each hour of the year.
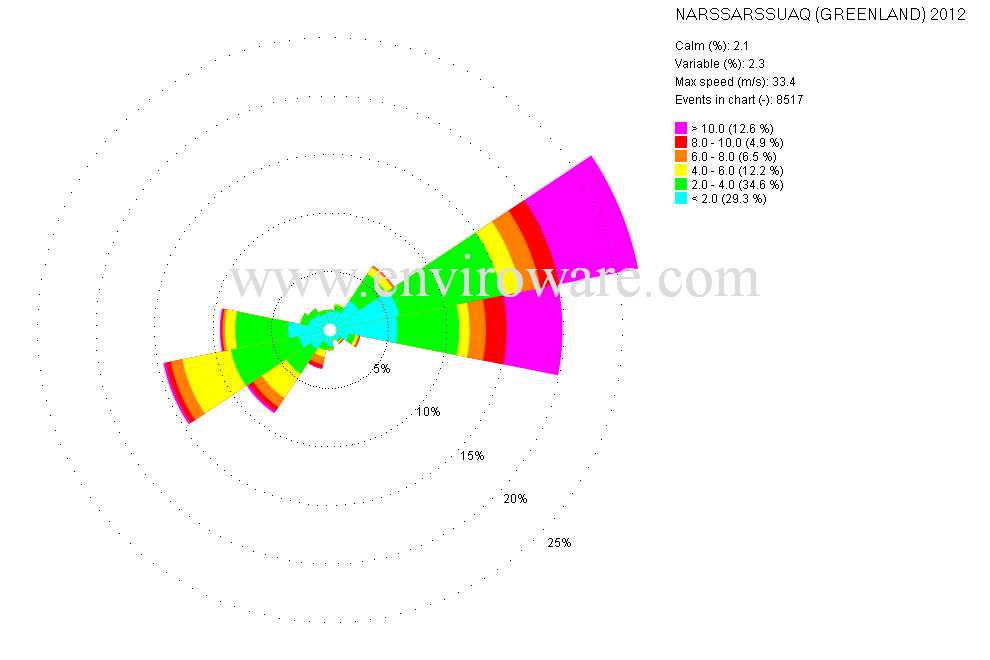
An example of the available wind roses is reported in the following image. The title indicates the city where the METAR station is located, the country and the time period to which the wind rose refers. Then there are some comments about the data: the percent of records indicated as calms in the METAR file, the percent of variable directions, the maximum wind speed in m/s, and the number of events represented in the chart (excluding calms, variable directions and possible invalid data). The legend represents the colours used for each wind speed interval and the corresponding percentage. For example, the image indicates that wind speeds between 2 m/s and 4 m/s are the 34.6% of the events, and they are represented in green.
We are aware that some wind roses indicate an unrealistic maximum wind speed, and we will check them to correct the problem. Such high wind speeds are wrongly indicated within the original METAR files and often are refer to a single hour of a year, therefore the shape of the wind roses is not affected. Simply do not consider the maximum wind speed if it is unrealistic.
If you need more professional wind roses and more complex analysis of your data, you might want to evaluate WindRose PRO.