Wind roses for year 2011
A wind rose is a chart which gives a view of how wind speed and wind direction are distributed at a particular location over a specific period of time. It is a very useful representation because a large quantity of data can be summarised in a single plot. Wind roses contain important information and are used in different fields as, for example, in air quality studies, in designing energy saving buildings, and in positioning wind turbines.
Enviroware offers many tools for producing wind roses starting from weather data which may be organised in different formats. The most powerful tool is WindRose PRO3, which is used by hundreds of people around the World. Other tools on the Enviroware web site allows to create simple wind roses directly on line, or using Microsoft Excel or Open Office Calc.
Continuing our experience in analysing weather data, we have developed a suite of Perl scripts which automatically download METAR data, decode them, and create wind roses. METAR is the file format adopted in the Aviation Routine Weather Reports. Such files typically come from airports or permanent weather observation stations; they are produced once an hour, but if conditions change significantly, a special report may be issued. METAR files are used both by pilots and by meteorologists. METAR must be decoded in order to understand the weather information contained. An example of METAR for the Pond Inlet airport (Canada) taken on November 1st 2009 at 04:03 UTC is the following one:
CYIO 010403Z AUTO 15012KT 1 3/8SM -SN VV008 M21/M22 A2945
- CYIO is the ICAO (International Civil Aviation Organization) code of the airport
- 010403Z indicates the first day of month (01) at time 04:03 UTC
- AUTO indicates that the report is fully automated, with no human intervention
- 15012KT indicates a wind blowing from 150 degrees with a speed of 12 knots
- Visibility is 3/8 Statute Miles
- Weather is characterised as: Light Snow
- Sky is obscured and vertical visibility: 800 feet
- Temperature: -21 degrees Celsius
- Dewpoint: -22 degrees Celsius
- QNH (barometric pressure adjusted to sea level): 29.45 inHg
The wind roses created starting from the METAR data for some thousands of sites and for year 2011 are can be viewed in Google Earth, or directly in your browser with Google Maps (in this case the images are a bit reduced in size in order to show them without scroll bars). Be aware that Enviroware has produced the wind roses with a careful analysis of the METAR data, however, Enviroware does not guarantee that the wind roses are correct, therefore the user can use such images under her/his own responsibility.
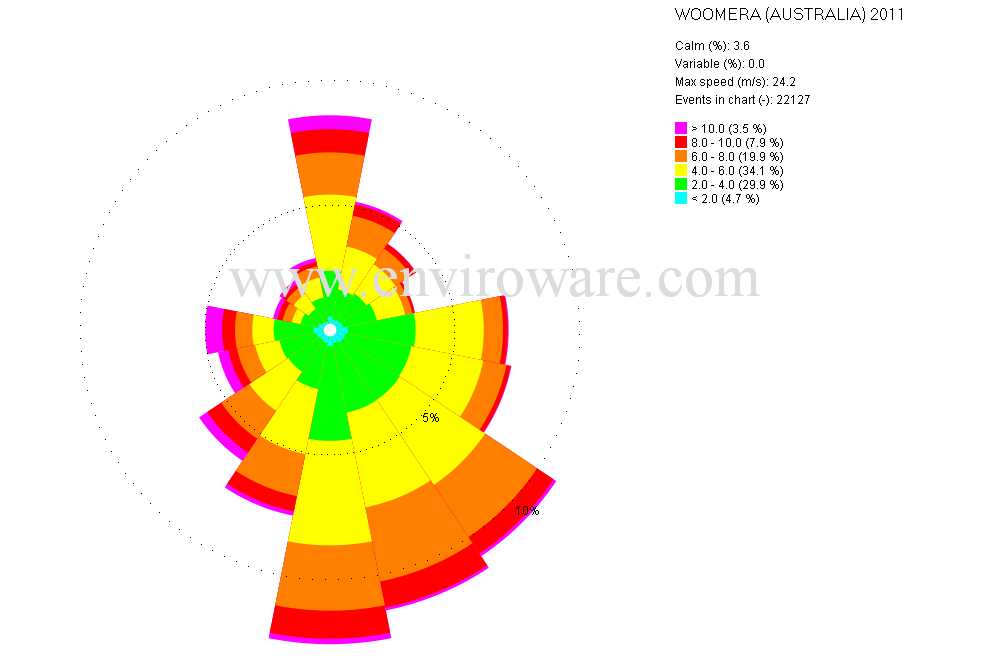
An example of the available wind roses, the following image is reported. The title indicates the city where the METAR station is located, the country and the time period to which the wind rose refers. Then there are some comments about the data: the percent of records indicated as calms in the METAR file, the percent of variable directions, the maximum wind speed in m/s, and the number of events represented in the chart (excluding calms, variable directions and possible invalid data). The legend represents the colours used for each wind speed interval and the corresponding percentage. For example, the image indicates that wind speeds between 2 m/s and 4 m/s are the 29.9% of the events, and they are represented in green.
If you need more professional wind roses and more complex analysis of your data, you might want to evaluate WindRose PRO.