Use WindRose PRO to produce a 3-variables plot
In a 3-variables plot WindRose PRO represents the third variable with circles of different colors which are placed at a radial distance given by the wind speed (or any other directional variable), and at an angular coordinate given by the wind direction (measured from North and increasing clockwise). This kind of plot can be used in air quality studies for estimating the presence of important sources of specific pollutants.
To create a directional graphic with 3 variables we will use the example file sample_3v, which is composed by 4 columns: Date and time [Date Time], concentration of an air pollutant [Conc (ug/m3)], wind direction [WD (deg)] and wind speed [WS (m/s)].
Open WindRose PRO, click Options and execute the following operations:
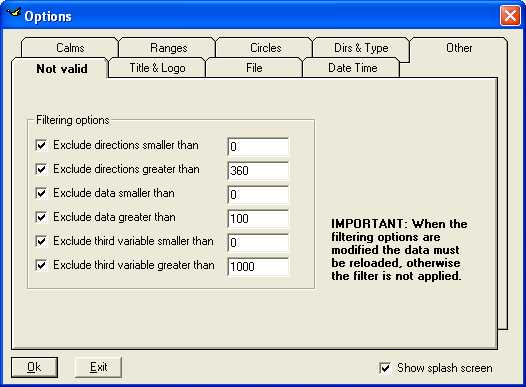
Select the Not valid tab and specify the range of acceptability of the data within the Excel file. Invalid data within the example file are written as -999, therefore we need to discard such values. We will accept wind directions within the range [0, 360], wind speeds within the range [0,100] (m/s), and concentration values within the range [0, 1000] (ug/m3).
Be sure to set the filter on valid data before loading the Excel file, because they are filtered while loading.
Select Dirs & type tab, then select Data within the frame Wind rose or data, and specify a point size (20 in the example). Then specify a scale in the text box named Scale for different plots (where different means that we are not producing a wind rose). This scale indicates the number of drawing points for each unit of the variable plotted. We will try with a scale of 250, it will be modified if it is too big or too small.

Select Title & logo and specify the title, its position and its color.

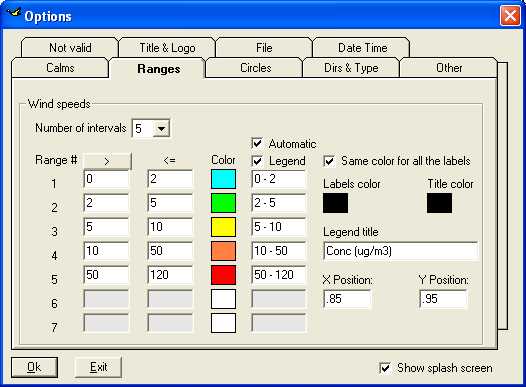
Select Ranges and specify the concentration intervals to plot and their colors. In this example we have chosen to use 5 concentration intervals. The maximum concentration value is 115 ug/m3; we choose to use the following intervals (in ug/m3): 0 - 2; 2 - 5; 5 - 10; 10 - 50; 50 - 120.
Click Ok to set the new options and close the mask.
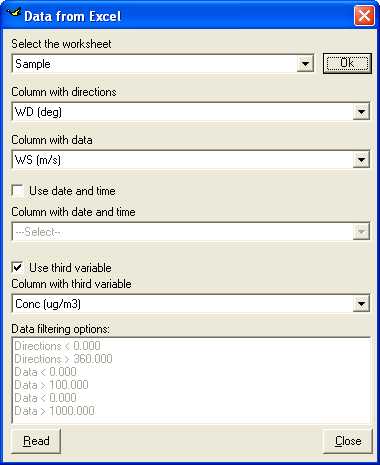
Click Load, select sample_3v from your PC, then select the Sample worksheet and press Ok. Now select the column containing wind direction (WD) and the one containing wind speed (WS). Check the Use third variable check box and select the column containing the third variable (Conc). We do not need to use date and time for this plot.
Note that the current data filtering options are written at the bottom of the input mask.
Click Read to load the data.
A total of 8760 hourly records (i.e. a whole year) is present within the file. The valid data (i.e. the records with all the fields different from -999) are 99.3% of the total (8703 records), as reported in the lower right corner of the WindRose PRO graphical interface.
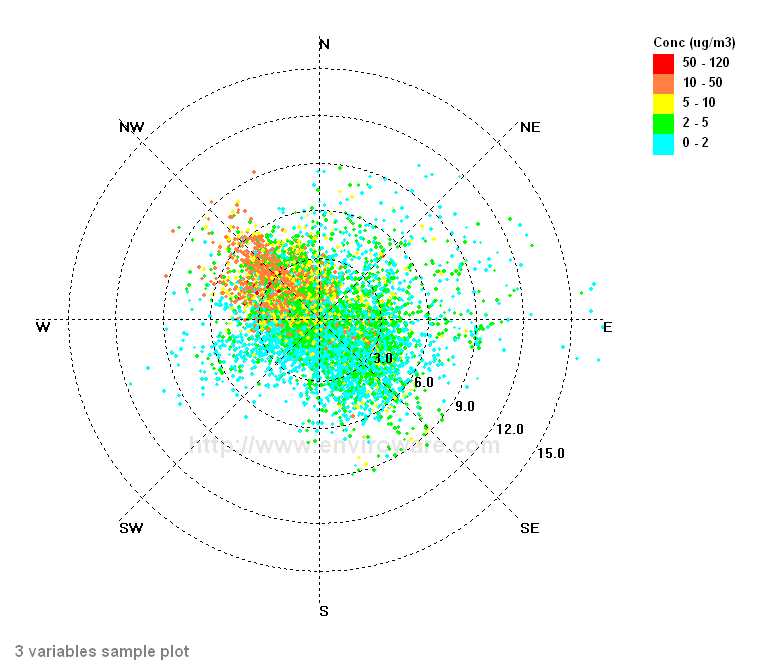
Click Analyse to process the data, then click Draw to produce the plot. WindRose PRO creates a plot like the one shown in the next figure. At this point the plot is not very clear yet, but an orange spot corresponding to high concentration values (i.e. greater than 10 ug/m3) is visible in the upper left quadrant.
To isolate the higher concentrations, click again on Options and Ranges, in the Number of intervals drop down select 2, and specify the two higher intervals considered in the previous plot, from 10 to 50 ug/m3 (orange) and from 50 to 120 ug/m3 (red). Then click Ok.

Click Analyse to process the data, then click Draw to produce the plot.
WindRose PRO produces a plot like the one shown in the figure on the left.
The plot indicates an important source of the pollutant considered (e.g. NOX, SO2, etc.) at North West of the point where wind and concentration have been measured.
WindRose PRO can then be used as a tool for evaluating the possible presence of important sources of air pollutants.
WindRosePRO 3