How to plot a wind rose with Python
In this post we show how to produce a simple wind rose of AERMET meteorological surface data using Python. Other directional data can be plotted after changing the function that reads and parses the input file.
AERMET is the meteorological preprocessor of AERMOD, the US-EPA preferred air quality dispersion model for State Implementation Plan (SIP) revisions for existing sources and for New Source Review (NSR) and Prevention of Significant Deterioration (PSD) programs.
AERMET produces a surface data file and a profile data file with hourly resolution. The input to AERMET are observed data at surface (i.e. onsite monitor data, measurements at airports inciluding ASOS, NWS stations data) and aloft (i.e. radiosounding data).
In alternative, input to AERMET can be generated using MMIF, a US-EPA postprocessor to the meteorological model WRF. This approach is recommended by US-EPA when no reliable data are available for the location of interest.
We provide an online meteorological modeling service to order a set of AERMET input (or output) files for any location of the world, for one ore more years in the past.
A wind rose is a chart which gives a view of how wind speed and wind direction are distributed at a particular location over a specific period of time. It is a very useful representation because a large quantity of data can be summarised in a single plot.
The Python library Windrose is an easy to use software to generate a windrose.
The Python code creating the windrose plot from AERMET surface data is the following (latest version is available on Github):
import os.path
import matplotlib
matplotlib.use('Agg')
import matplotlib.pyplot as plt
import matplotlib.cm as cm
from windrose import WindroseAxes
def load_aermet_sfc_file(ff):
# This is a function to read AERMET surface file. Change it to read other formats.
myfile = open(ff,"r",newline="\n")
lines = myfile.readlines()
# Header record
(latitude,longitude,ua_identifier, sf_identifier, os_identifier, version_date) = [lines[0].split()[i] for i in (0,1,3,5,7,9)]
wind = []
for line in lines[1:]:
(year,month,day,j_day,hour,h_sens,u_star,w_star,vptg,zic,zim,lmo,z_zero,bowen,albedo,ws,wd,zref,temp,ztemp,ipcode,pamt,rh,pres,ccvr,wsadj,extra) = line.split()
wind.append([float(wd),float(ws)])
myfile.close()
d = dict()
d['wind'] = wind
d['latitude'] = latitude
d['longitude'] = longitude
return d
sfc_file = input("Please enter AERMOD.SFC file name: ")
if not os.path.exists(sfc_file):
print(sfc_file+" does not exists.")
exit()
d = load_aermet_sfc_file(sfc_file)
wd = []
ws = []
for pair in d['wind']:
wd.append(pair[0])
ws.append(pair[1])
ax = WindroseAxes.from_ax()
ax.bar(wd, ws, normed=True, opening=0.8, edgecolor='white',cmap=cm.hot)
ax.set_legend()
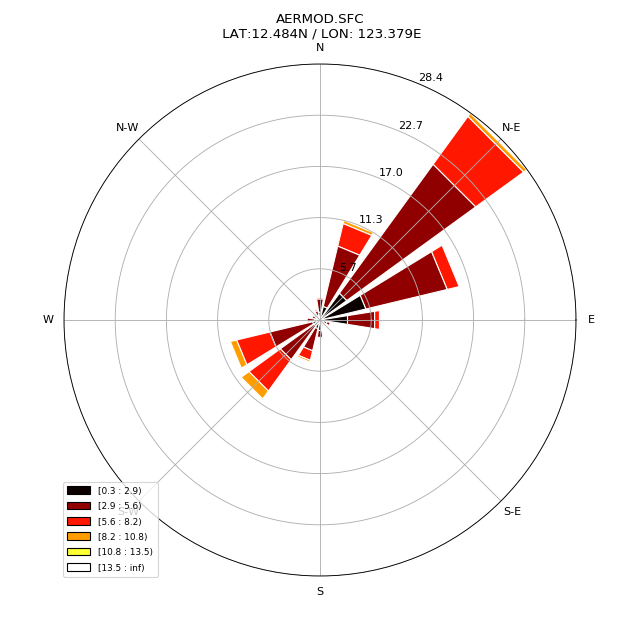
plt.suptitle('LAT:'+d['latitude']+ ' / LON: '+d['longitude'])
plt.savefig(sfc_file+".png")
print("Windrose plot saved as "+sfc_file+".png")
A sample AERMOD.SFC file is available for download here.
In order to generate a windrose plot, save the above code in a text file named 'plot_windrose.py' and, form command line, run:
$ python3 plot_windrose.py
Insert the file name as requested (AERMOD.SFC or path and filename to your file) and a PNG file with the windrose shown above will be generated in the same folder storing your input data file.
If you need more elaborated wind roses and more complex analysis of your data, you might want to evaluate WindRose PRO.
Download the free evaluation of WindRose PRO3