Create your wind roses online
You can use our on line tool for creating wind roses and similar charts for other directional data. Some example data are pre-loaded, in order to show how the tool works. You can simply play with the example data, or insert your own data. Save your chart by clicking over it with the right mouse button.
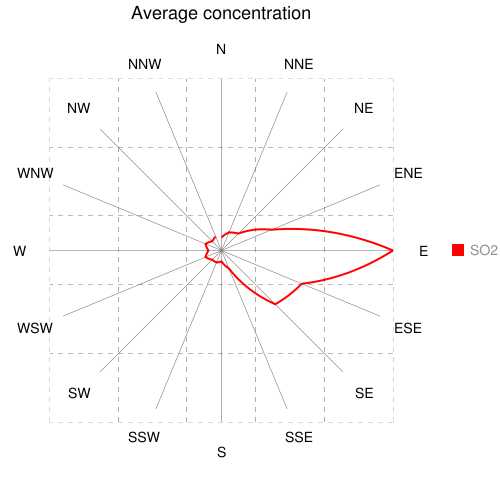
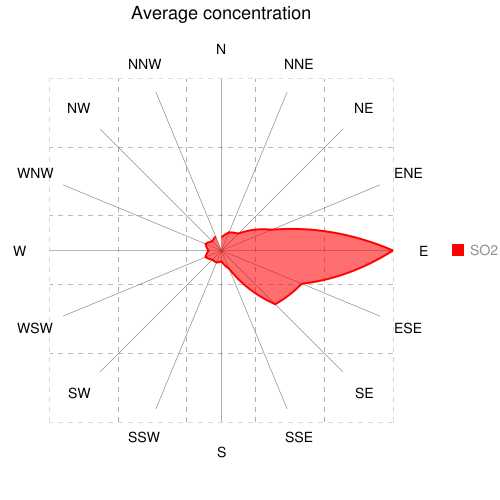
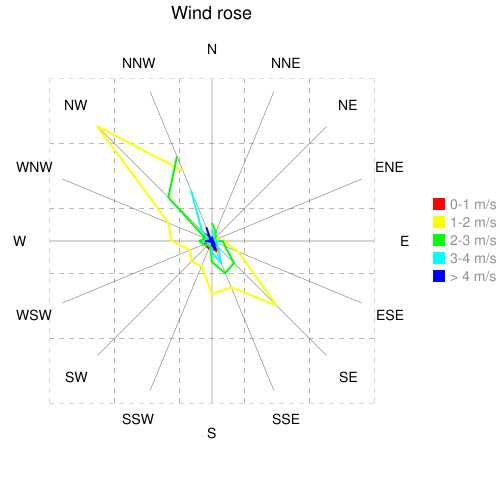
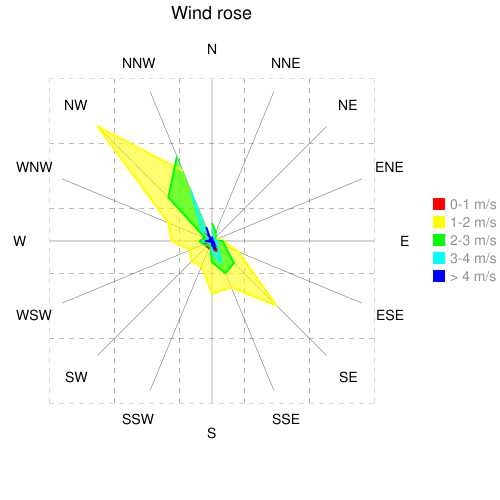
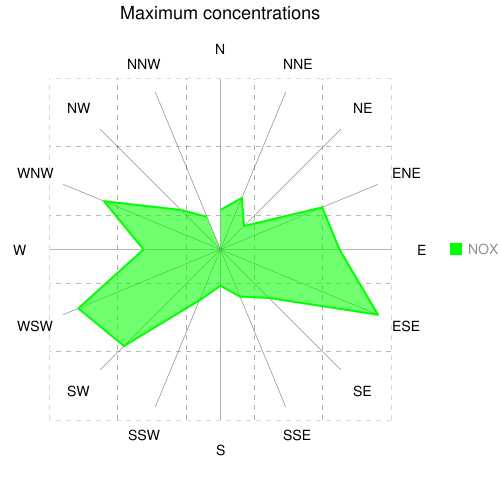
Specify a title for your chart, then insert your directional data within the table. In the first row specify the labels for the directional variable classes. For example, if your directional variable is wind speed, you could have the following five classes: 0 - 1 m/s, which means speeds between 0 m/s and 1 m/s, 1 - 2 m/s, 2 - 3 m/s, 3 - 4 m/s and > 4 m/s. Then specify the number of events, or the percentage, within each combination of direction and class of the directional variable. For example, if a wind speed smaller than 1 m/s is observed 300 times from North, write 300 within the leftmost cell of direction North (indicated with N). The wind rose will be produced for a total of 16 directions, each one representing 22.5 degrees. The first direction is centred on North (i.e. 0 degree), and the last one on NNW (i.e. 337.5 degree). You can also indicate which class to plot, and if it must be filled or not.
Do not forget to link this page if you like the tool or if you use the images produced with it.
If you need advanced features, evaluate out WindRose PRO software.